.png)
Milosz
Zeglarski
Use Metrics to Scale Model Serving Deployments in Kubernetes
In this blog you will learn how to set up horizontal autoscaling in Kubernetes using inference performance metrics exposed by OpenVINO™ Model Server. This will enable efficient scaling of model serving pods for inference on Intel® CPUs and GPUs.
Why use custom metrics?
OpenVINO™ Model Server provides high performance AI inference on Intel CPUs and GPUs that can be scaled in Kubernetes. However, when it comes to automatic scaling in Kubernetes, the Horizontal Pod Autoscaler by default, relies on CPU utilization and memory usage metrics only. Although resource consumption indicates how busy the application is, it does not clearly say whether serving provides expected quality of service to the clients or not. Since OpenVINO Model Server exposes performance metrics, we can automatically scale based on service quality rather than resource utilization.
The first metric that comes to mind when thinking about service performance is the duration of request processing, otherwise known as latency. For example, mean or median over a specified period or latency percentiles. OpenVINO Model Server provides such metrics but setting autoscaling based on latency requires specific knowledge about each model and the environment where the inference is running in order to properly set thresholds that trigger scaling.
While autoscaling based on latency works and may be a good choice when you have model-specific knowledge, we will instead focus on a more generic metric using ovms_requests_streams_ratio. Let’s dive into what this means.
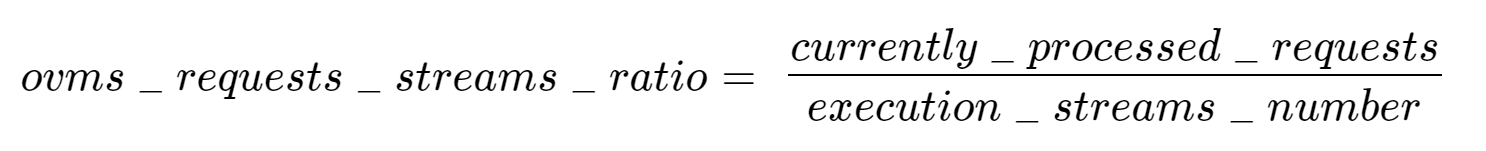
In the equation above:
- currently_processed_requests - number of inference requests to a model being processed by the service at a given time.
- execution_streams_number – number of execution streams. (When a model is loaded on the device, its computing units are divided into streams. Each stream independently handles inference requests, meaning that the number of streams defines how many inferences can be run on the device in parallel. Note that the more streams there are, the less powerful they are, so we get more throughput at a cost of higher minimal latency / inference time.)
In this equation, for any model exceeding a value of 1 indicates that requests are starting to queue up. Setting the autoscaler threshold for the ovms_requests_streams_ratio metric is somewhat of an arbitrary decision that should be made by a cluster administrator. Setting the threshold too low will result in underutilization of nodes and setting it too high will force the system to work with insufficient resources for extended periods of time. Now that we have chosen a metric for autoscaling, let’s start setting it up.
Deploy Model Server with Autoscaling Metrics
First, we need to create a deployment of OpenVINO Model Server in Kubernetes. To do this, follow instructions to install the OpenVINO Operator in your Kubernetes cluster. Then create a configuration where we can specify the model to be served and enable metrics:
Create ConfigMap:
With the configuration in place, we can deploy OpenVINO Model Server instance:
Create ModelServer resource:
Deploy and Configure Prometheus
Next, we need to read serving metrics and expose them to the Horizontal Pod Autoscaler. To do this we will deploy Prometheus to collect serving metrics and the Prometheus Adapter to expose them to the autoscaler.
Deploy Prometheus Monitoring Tool
Let’s start with Prometheus. In the example below we deploy a simple Prometheus instance via the Prometheus Operator. To deploy the Prometheus Operator, run the following command:
Next, we need to configure role-based access control to give Prometheus permission to access the Kubernetes API:
The last step is to create a Prometheus instance by deploying Prometheus resource:
If the deployment was successful, a Prometheus service should be running on port 9090. You can set up a port forward for this service, enabling access to the web interface via localhost on your machine:
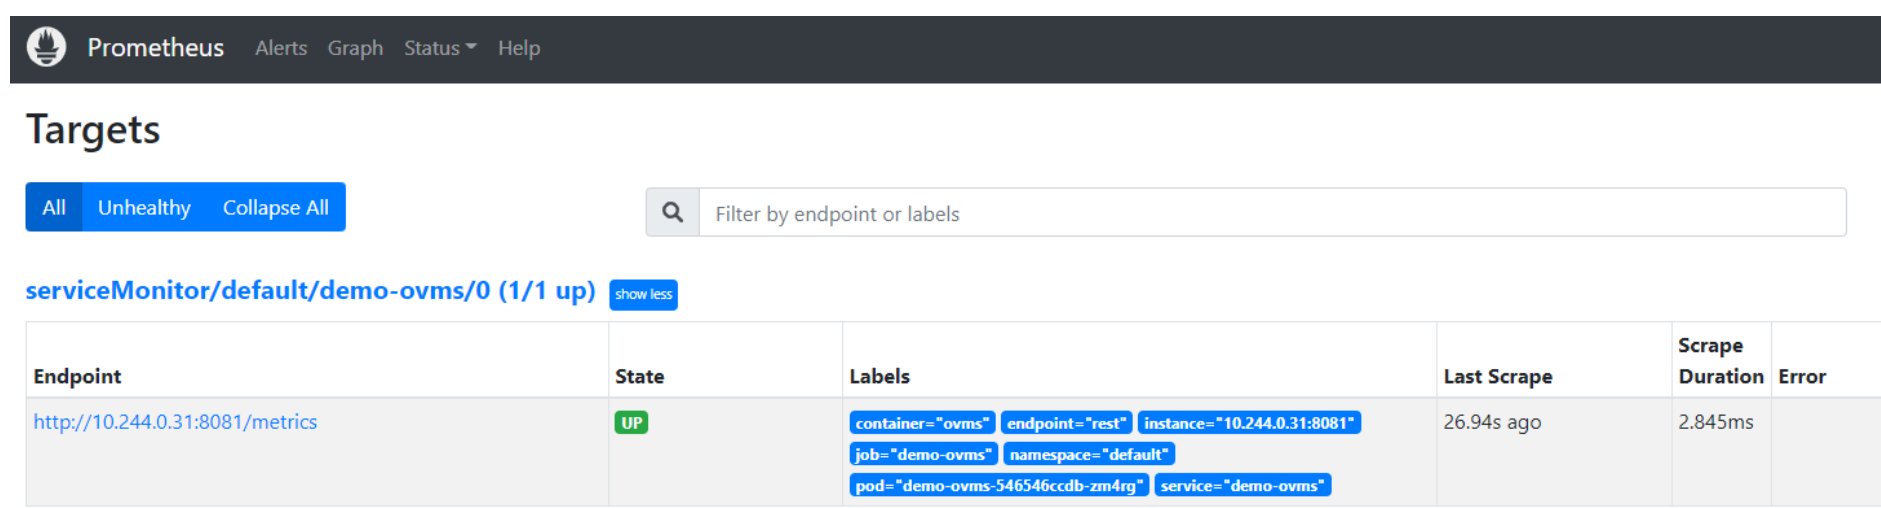
Now, when you open http://localhost:9090 in a browser you should see the Prometheus user interface. Next, we need to expose the Model Server to Prometheus by creating a ServiceMonitor resource:
Once it’s ready, you should see a demo-ovms target in the Prometheus UI:
Now that the metrics are available via Prometheus, we need to expose them to the Horizonal Pod Autoscaler. To do this, we deploy the Prometheus Adapter.
Deploy Prometheus Adapter
Prometheus Adapter can be quickly installed via helm or step-by-step via kubectl. For the sake of simplicity, we will use helm3. Before deploying the adapter, we will prepare a configuration that tells it how to expose the ovms_requests_streams_ratio metric:
Create a ConfigMap:
Now that we have a configuration, we can install the adapter:
Keep checking until custom metrics are available from the API:
Once you see the output above, you can configure the Horizontal Pod Autoscaler to use these metrics.
Set up Horizontal Pod Autoscaler
As mentioned previously, we will set up autoscaling based on the ovms_requests_streams_ratio metric and target an average value of 1. This will try to keep all streams busy all the time while preventing requests from queueing up. We will set minimum and maximum number of replicas to 1 and 3, respectively, and the stabilization window for both upscaling and downscaling to 120 seconds:
Create HorizontalPodAutoscaler:
Once deployed, you can generate some load for your model and see the results. Below you can see how Horizontal Pod Autoscaler scales the number of replicas by checking its status:

This data can also be visualized with a Grafana dashboard:
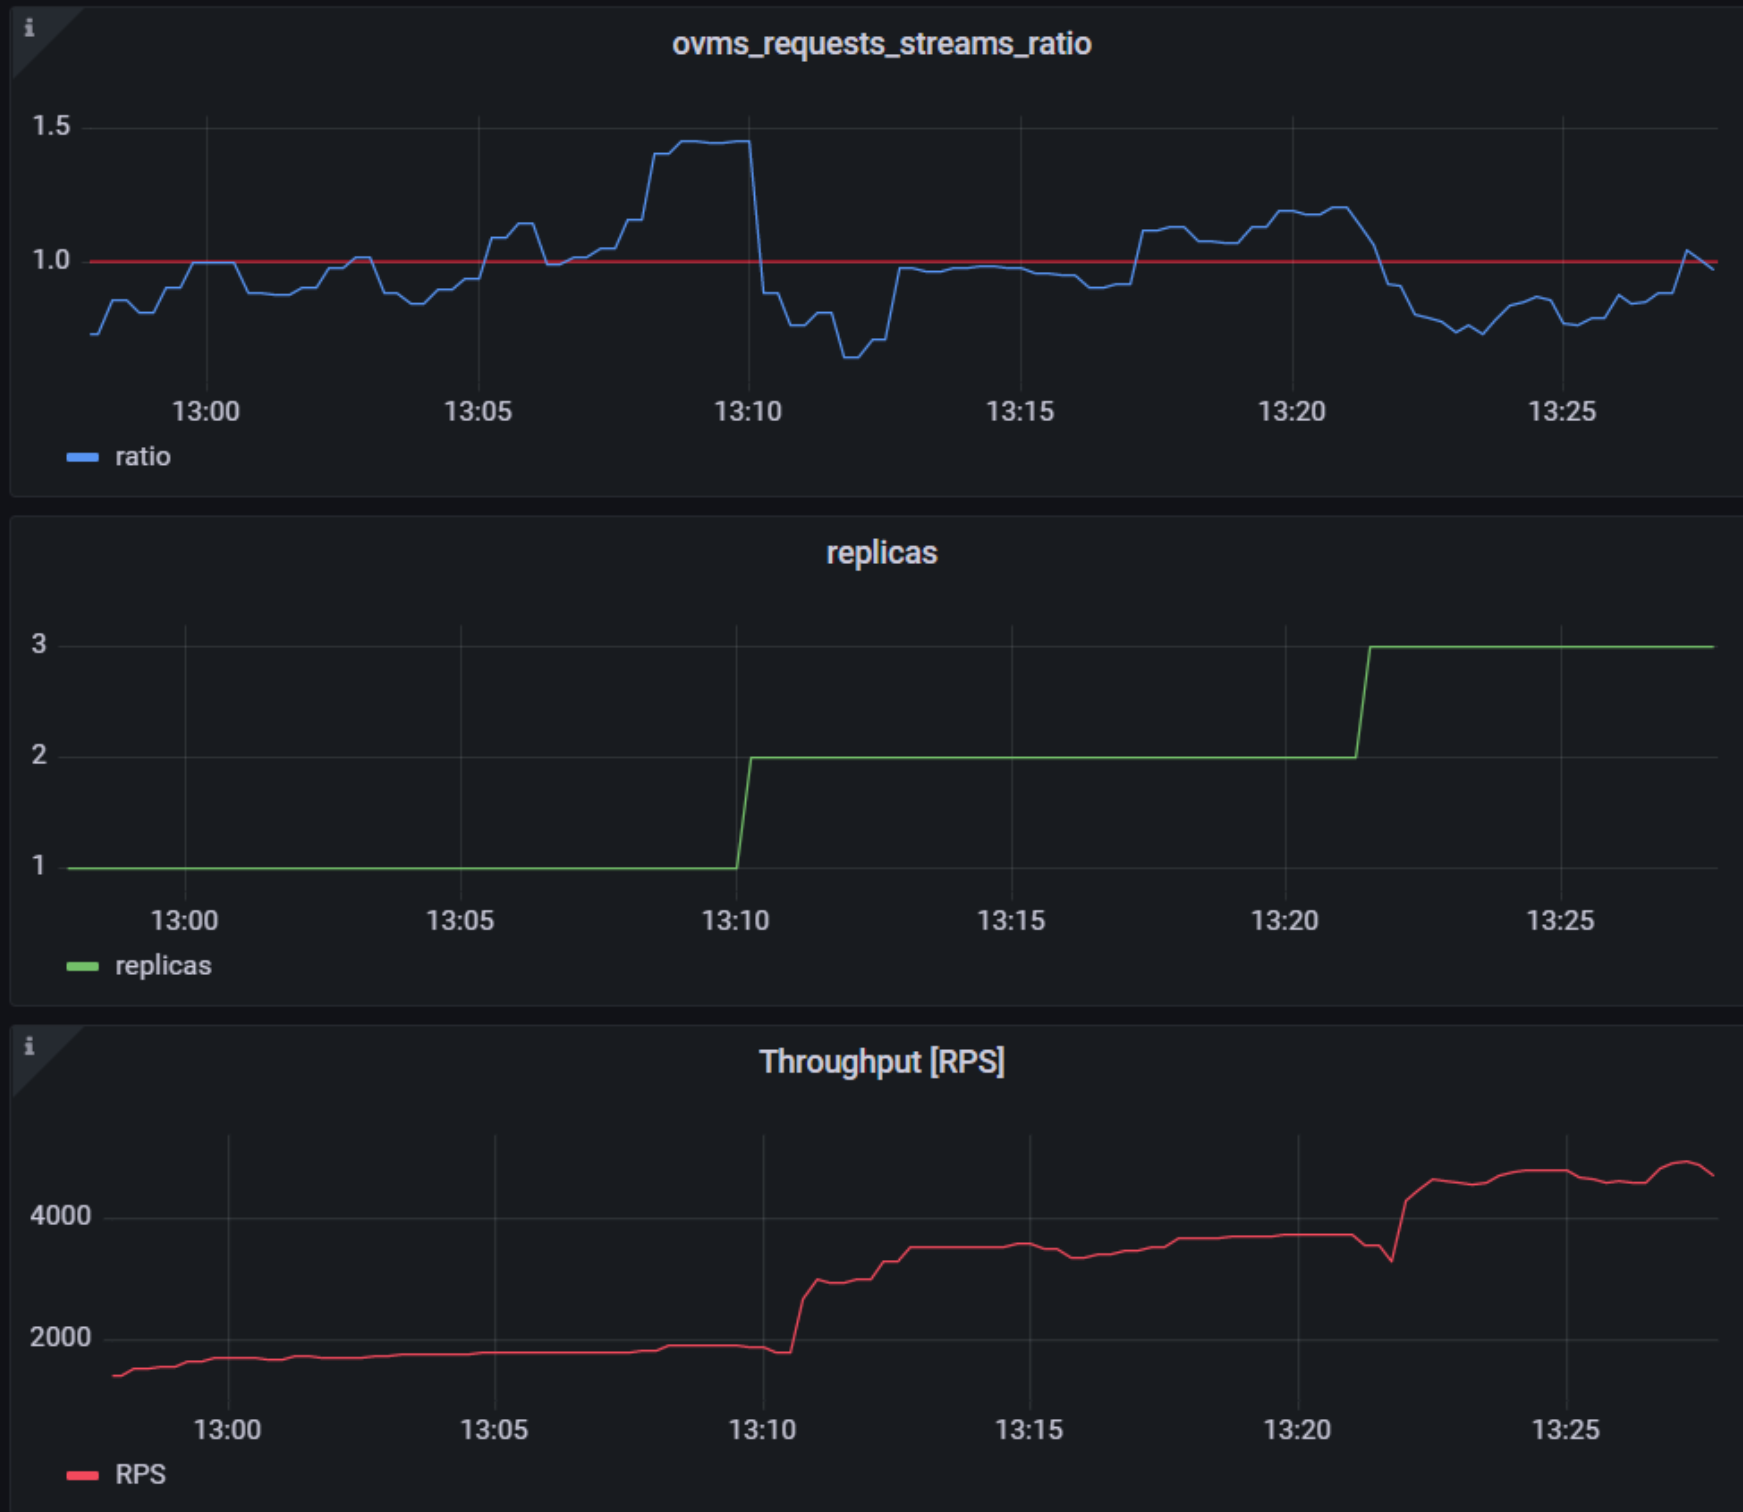
As you can see, with OpenVINO Model Server metrics, you can quickly set up inferencing system with monitoring and autoscaling for any model. Moreover, with custom metrics, you can set up autoscaling for inference on any Intel CPUs and GPUs.
See also:
- Load Balancing OpenVINO Model Server Deployments with Red Hat
- Kubernetes Device Plugin for Intel GPU
- OpenVINO Model Server metrics